In a comprehensive new study, Norwegian marine insurance group Gard has measured the impact of weather on container stack collapses. Its findings show the impact of progressively increasing wave height, the quantified risk of high waves, and variance in weather exposure among different operators.
As the world economy develops, the volume of containerized trade increases steadily, the study noted. Last year, the global container shipping fleet grew by almost four per cent according to UNCTAD, and in Gard’s P&I portfolio, the segment has increased by as much as 16 per cent over the past five years. It currently makes up 18 per cent of the insured vessels.
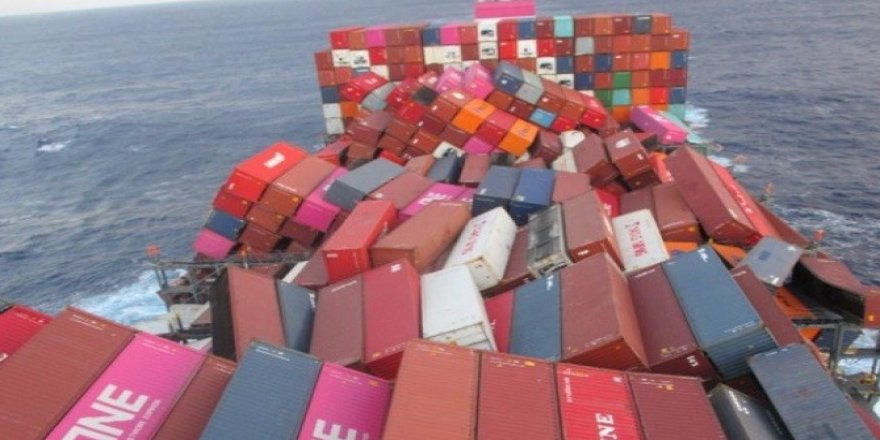
With more container shipping comes also a higher risk of casualties. Certain incidents, such as stack collapses or containers lost at sea, are monitored closely as they tend to be relatively more severe. Container losses also have the IMO’s attention, and they are working on making reporting of lost containers mandatory. Meanwhile, insurers and other key stakeholders are involved in detailed work such as the Top Tier project to investigate the causes of stack collapse and seek solutions.
To contribute to the industry understanding and to help prevent losses, Gard has studied all cases of stack collapse where Gard was involved as a P&I insurer. These cases occurred between 2016-2021. The study looked at the weather data to understand the factors contributing to these incidents.
More specifically, the study combined Gard claims data with geographical and meteorological data from Windward which includes estimated wave height and wind strength on an hourly basis. When it comes to waves, several measures are common.
For each claim Gard collected meteorological data for the incident date as well as the six days leading up to the day of the incident. This allows us to analyse how the weather progressively worsened over a period of time.
Analysing incident numbers relative to number of vessels in our portfolio provides valuable insights on claims frequency across different size segments, which can range from feeders (less than 3,000 teu) to ultra-large container vessels (ULCVs) exceeding 15,000 teu where the stack heights can exceed 10 high on deck. Despite a higher number of incidents on smaller vessels, there is a clear correlation between incident frequency (or likelihood) and vessel size. The 6-year average claims frequency for stack collapses on feeder vessels is 1%, whereas for ULCVs, it rises to 9%.
When looking at a 7-day period before the incident, Gard noticed that on Day 1, vessels are on average experiencing wave heights of 2.5m, which corresponds to wind force 5 on the Beaufort scale. The weather then progressively worsens, and this increase in wave height is more pronounced from Day 6 onwards.
The average wave height peaks on Day 7 at 6.5m which corresponds to gale force winds. The duration for which the vessels were exposed to sea conditions with wave heights of 4m and above (corresponding to near gale force winds or stronger) was 72 hours.
It was therefore evident that the vessels experienced average wave heights which progressively increased by two and a half times during the 7-day period. Interestingly, the incidents did not always happen when the wave height was the highest, but after the weather had started to subside. This might be partly due to the fact that the time of reporting the incident to Gard may not always coincide with the time of the incident itself.
Higher waves – higher risks
To further study the exposure to high waves, Gard looked at vessels that are exposed to a wave height of 7m (corresponding to Bf 8 gale force winds) or above. An observation of interest was that while vessels involved in incidents spent only 5% of their time in wave heights exceeding 7 meters during the incident year, half of all incidents occurred during such conditions.
Analysing the maximum wave heights experienced by vessels on the day of the incident reveals a similar pattern. Essentially, despite spending 95% of their time in calmer waters, the relatively small percentage spent in adverse conditions significantly amplifies the risk of incidents, potentially up to 20 times higher, as indicated by the study.
Another finding was that among the vessels that had a stack collapse incident, the share of vessels exposed to such high waves increased by almost 12 times from day 1 to day 7. This suggests that these vessels may not have been able to avoid such heavy weather in spite of the advanced weather routeing tools available.
Examining the global container fleet, roughly 3.4 per cent are exposed to such weather at any given time. Among various size segments, the new Panamax 1 segment (8,000 – 12,000 teu) appears to have a higher exposure to wave heights of 7 meters and above compared to any other size category. This trend is also evident for wave heights around 4 meters.
In conclusion, the study emphasizes that exposure to worsening weather presents a clear risk, and the industry needs to reconsider their weather thresholds and provide seafarers with appropriate tools for evaluating the risk of intricate phenomena such as rolling. Further, maintenance of securing equipment and cargo securing within containers need to be considered, and effective weather routeing should be included as key performance indicators.
(Photo on Twitter of November 2020 incident of more than 1,800 containers lost when the ONE Apus encountered exceptionally heavy rolling waves in the Pacific Ocean 1,600 nautical miles from Hawaii.)


